Enhance your Log Analytics data exploration in Azure Data Studio
The Azure Monitor Logs extension in Azure Data Studio is now available in preview. The extension is supported in Azure Data Studio August 2021 release, v1.32.0.
Administrators can enable platform logging and metrics to one of their Azure services such as Azure SQL and set the destination to Log Analytics workspace. By installing native Azure Monitor Logs extension in Azure Data Studio, users can connect, browse, and query against Log Analytics workspace. Data professionals who are using Azure SQL, Azure PostgreSQL, or Azure Data Explorer in Azure Data Studio can access the data in the Log Analytics workspace for diagnosis or auditing in that same development environment. This native Azure Monitor Logs extension allows Azure service customers to also author notebooks with Log Analytics kernel, all equipped with Intellisense.
Examples for Azure SQL users
While the examples in this section are specific to Azure SQL scenarios, Azure Monitor Logs can also capture events from other Azure resources, such as Azure Functions or Azure Web Apps. Now, let’s dive into these examples where users can leverage Log Analytics workspace data to better understand an Azure SQL database.
Example One: Who dropped a table in my database?
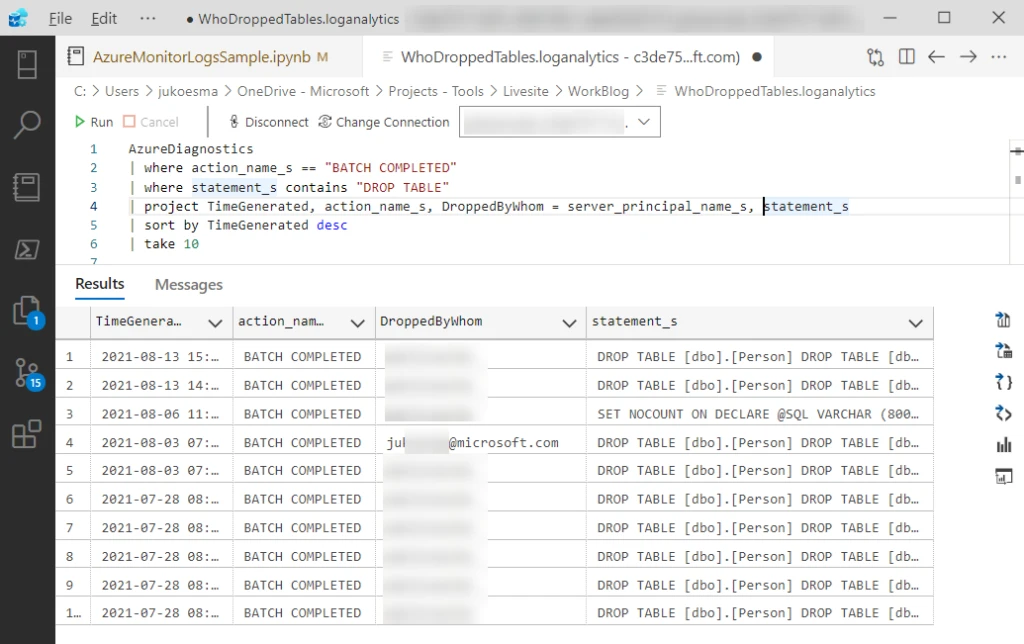
Connect to your Log Analytics workspace that captures the Azure SQL audit events. Right-click and choose New Query from the menu. Copy the following query and paste it to Query editor in Azure Data Studio.
AzureDiagnostics
| where action_name_s == "BATCH COMPLETED"
| where statement_s contains "DROP TABLE"
| project TimeGenerated, Category, OperationName, server_principal_name_s, statement_s
| sort by TimeGenerated desc
| take 10

In this example, a good question to ask might be, why are these users executing a lot of drops during this time?
Example Two: What type of errors happen?
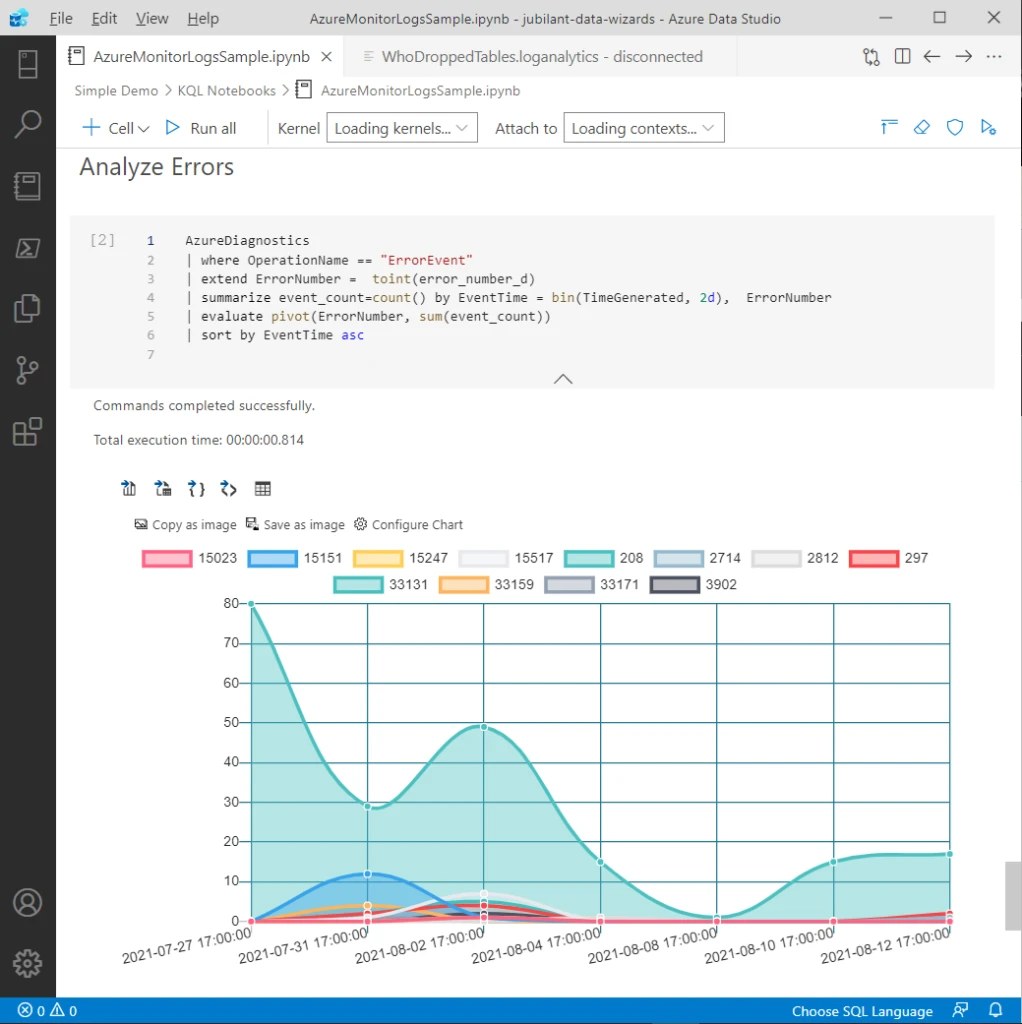
Connect to your Log Analytics workspace that captures the Azure SQL error events. Right-click and choose New Notebook from the menu. Copy the following query and paste it to Query editor in Azure Data Studio.
AzureDiagnostics
| where OperationName == "ErrorEvent"
| extend ErrorNumber =  toint(error_number_d)
| summarize event_count=count() by EventTime = bin(TimeGenerated, 2d),  ErrorNumber
| evaluate pivot(ErrorNumber, sum(event_count))
| sort by EventTime asc

In this example, we see a timeline with two-day intervals that maps error count by error number. A good question would be to understand why error 208 happens a lot.
Overall benefits
Here are four key benefits of using Azure Monitor Logs extension in Azure Data Studio.
- Efficiency in data exploration and data analysis. Users now have access to their SQL data sources in the same place as their Log Analytics workspaces. Users can also use Sand Dance extension to further enhance their data exploration and analysis.
- Reproducible analysis and diagnosis with notebooks.
- Improved DevOps troubleshooting experience with Azure Monitor Logs notebooks. This is illustrated in the previous examples.
- Version control the queries and notebooks directly with git in Azure Data Studio. Users can also add these files as part of their CI/CD pipelines in GitHub or Azure DevOps.
Other related extensions: Kusto (KQL) extension which works for Azure Data Explorer
How to get started
- Azure Monitor Logs Extension for Azure Data Studio (preview)
- Create diagnostic settings to send platform logs and metrics to different destinations
- SQL to Kusto cheat sheet
- What is Azure Monitor Logs?
- Using SandDance visualizations
This preview release is the beginning of a strategic journey to richer end-to-end DevOps with Data in Azure Data Studio. Please feel free to submit your suggestions and bugs on GitHub.


