Simplifying Management of PDW Appliances with System Center
SQL Server Parallel Data Warehouse (PDW) is a highly scalable appliance for enterprise data warehousing that enables massive scalability, predictable performance, and complete BI solution at low cost. PDW ships with a web based management console for monitoring the health of PDW appliance and resolving issues. The appliance model and this web based tool simplify the management of large data warehouses by enabling DBAs to manage several data racks from a single interface.
Enterprise customers would love to include PDW appliances in their enterprise monitoring solutions such as System Center Operations Manager (SCOM). The new PDW management pack (MP) delivers this critical functionality to our enterprise customers by accurately and consistently representing the health of PDW appliances, thereby enabling the datacenter operators to manage the PDW appliances seamlessly from a ‘single pane of glass’. In addition, it also empowers IT to manage all their SQL Server Data Warehouses, including Fast Track and SQL Server instances, from a single place. This blog provides an overview of PDW management pack (MP) feature set. You can download the management pack here.
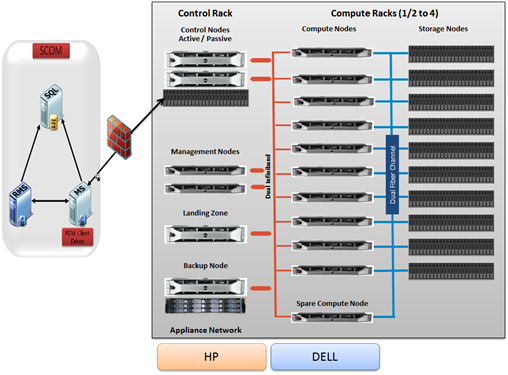
The following diagram shows the high level physical architecture of PDW appliance monitored by SCOM.
(Click on image above for full size)
PDW MP Functionality can be broken down into the following three core capabilities:
1. Discover the appliance and individual nodes
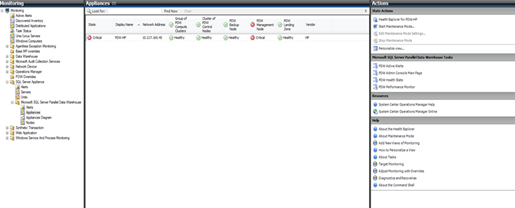
Discovery of the PDW appliance is as straight forward as creating an ODBC connection to the PDW appliance from the SCOM server. Once the ‘run-as account’ in SCOM is mapped to the right profile, the PDW MP will start discovering all nodes within the appliance and their roles. Just add more ODBC DSNs to monitor additional appliances, but make sure to add new ‘run-as accounts’ for each appliance if the monitor credentials are different on each PDW instance. SCOM will automatically discover the connection and then add the appliance to the list of appliances monitored. You do not have to install any agents on the PDW appliance. The following screen shot shows you the appliance and appliance nodes post discovery.
Appliance discovery – The appliance discovery includes the vendor type (HP/Dell). The health of multiple PDW appliances can be monitored from the same view.
(Click on image above for full size)
Appliance node discovery – Shows you the list of all the nodes within the appliance and their roles
(Click on image above for full size)
2. Actively monitor the health of the appliances
The PDW MP issues queries from the SCOM server to the PDW Control Node. It uses the same Dynamic Management Views (DMVs) for monitoring that are used in the PDW administration portal. This way there is consistency in the health displayed in the administration console and the SCOM console. The health from the lowest component is rolled up from the individual nodes to indicate the overall health of the appliance.
- State view – This view is consistent with the PDW administrator console view. The appliance node state view (see previous diagram) shows the rollup from individual components of the node that make up the node’s health model. These component groups include storage internal, processing, power supply, cooling, cluster, Software networking and Storage external. This view allows you to see the health of all the nodes from all appliances your organization owns in a single view. The filter box allows at the top allows the admin to narrow down to specific appliance nodes.
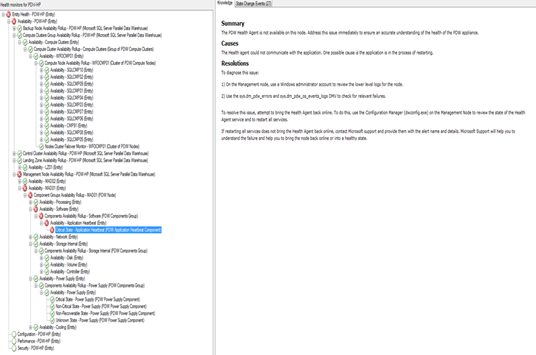
- Health explorer – The health explorer is a very powerful view that provides drill down capabilities from higher level appliance health to most granular component. Along with each state, we have detailed knowledge that provides guidance to the IT administrator. This will include the summary, cause and resolution of each and every state. See the sample screen shot below. In the example, we can see that the heartbeat monitor from node ‘MAD01’ caused the appliance to get into a critical state.
(Click on image above for full size)
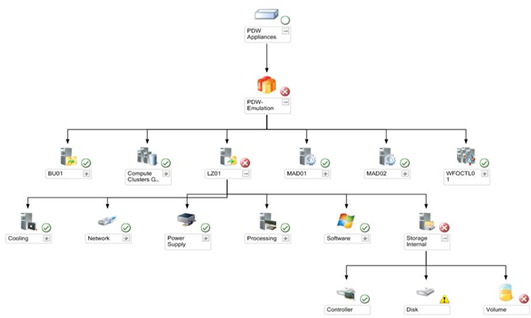
- Diagram view – In addition to the health explorer view, the PDW MP provides a more visual and intuitive way of visualizing the health of the appliance called the Diagram View. You can use the “filter by health” option on the menu bar to highlight the critical problem path. In this example, you can drill into the appliance all the way down to the ‘landing zone’ node to find out that volume free space is in a critical state (which means there is less than 10% free). In addition, the PDW MP supports the notion of multiple compute and control clusters (aka racks). This view helps the IT administrator to easily identify the problem node within a given cluster.
(Click on image above for full size)
3. Proactively notify the IT administrator before the appliance health is critical
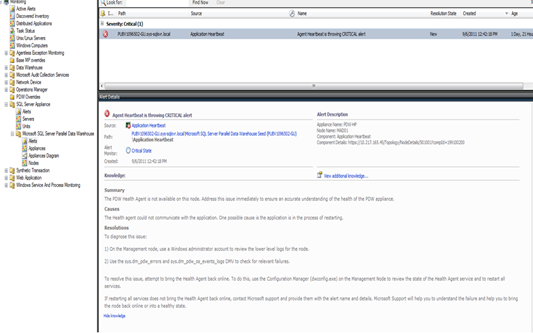
- Alerts view – SCOM allows organizations the ability to configure notifications (via E-mail, SMS) and see alerts in one place from all PDW appliances that are monitored. The PDW MP provides lot of flexibility to the IT admin to configure warning or critical alerts for things such as free space, hard disk failure; service state and node failover. The following screen shot shows the alert for when the heartbeat state on the node ‘MAD01’ is critical. Administrators can configure SCOM to send emails to an IT Operations group whenever these alerts are fired. This capability of SCOM really simplifies monitoring the PDW appliances.
(Click on image above for full size)
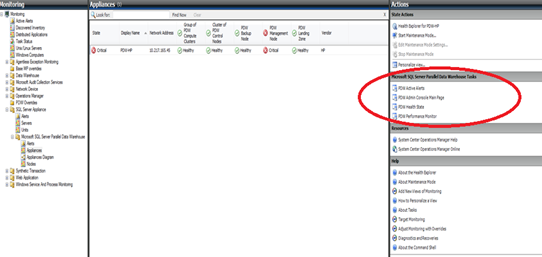
- Tasks – PDW MP provides contextual tasks that will redirect the IT administrator to the relevant page on the PDW administration portal for a deeper level troubleshooting
(Click on image above for full size)
Summary
The PDW management pack:
- Simplifies manageability of PDW appliance by enabling IT administrators to manage several data racks from a single interface and allowing drill down capabilities from higher level appliance health to most granular component.
- Proactively notifies the IT admin before the state of the appliance goes critical.
- Delivers on ‘single pane of glass’ monitoring experience across all SQL Server Data Warehouses including Fast Track and other SQL Server instances seamlessly from System Center.
Vinay Balasubramaniam
Senior Program Manager, SQL Server
Microsoft Corp

