Introducing desktop flow activity (preview)
We are happy to announce the new desktop flow activity section (in preview) in the Monitor section of Power Automate for all our customers.
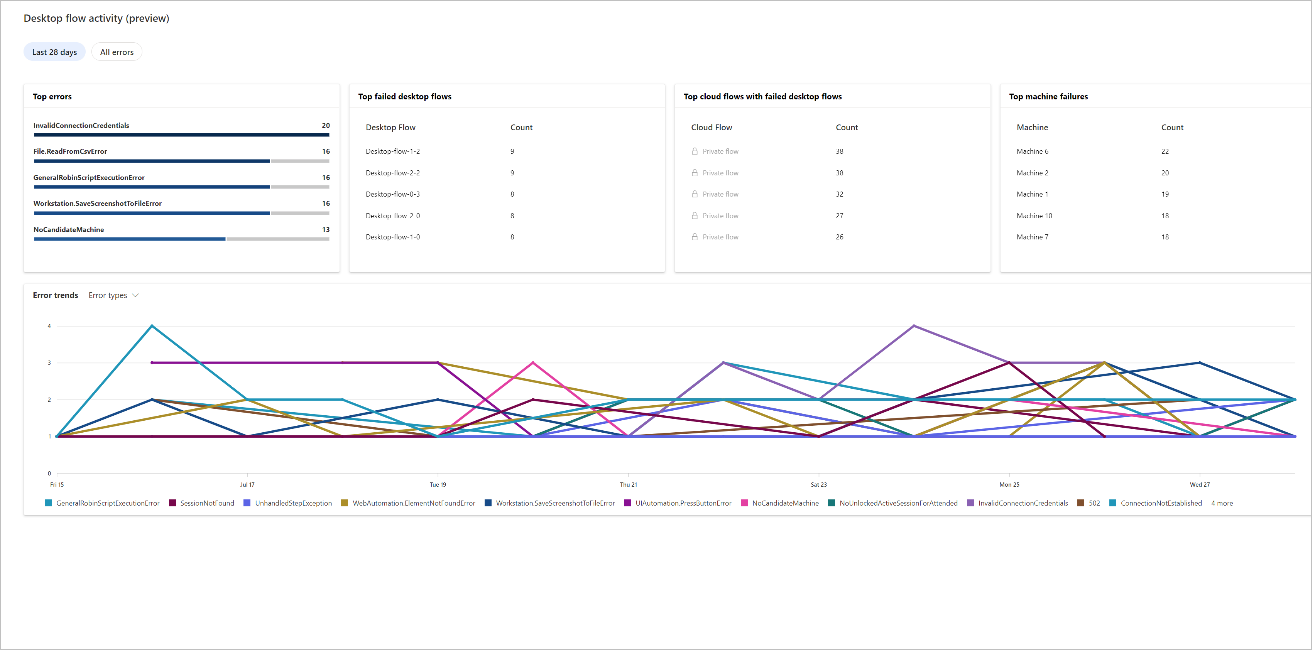
This “desktop flow activity” section provides to RPA users dashboards, tables and graphs to better understand desktop flows usage, measure effectiveness and quick identify issues.
This feature is now available for all the users (not only admins) based on permissions they have on flows, machines.
Identify your main errors
This first iteration provides the errors pivot:
- This pivot will help customers to quickly identify the most common errors you encounter during the execution of your flows.
- The goal of this pivot is to provide the information of desktop flows, cloud flows and machines that are impacted by these errors and allow customers to directly reach the different details pages to quickly understand issues.

Coming next
In the next weeks, we will add new pivots for desktop flow activity:
- Last runs pivot: this section will provide graphs and tables to get meaningful insights about your desktop flows runs (number of runs, % of errors, run modes, trends, etc..). CoEs will use this pivot to monitor their automations within one aggregated view
- Real-time pivot: this section will provide an realtime view of flows that are currently running and the ones that are queued
- Machines pivot: this section will provide you an overall view of your park of machines, understand utilization, identify machines who failed the most, machines that needs to be updated.
Hoping that you will find the above updates useful, please feel free to provide your questions and feedback in the Power Automate Community. If you want to learn more about Power Automate Desktop, get started with the below resources:
