Monitor now supports model-driven apps
“Why is my form performing so slowly?” “Where is this script error coming from?” “Why is my field control not showing up?”
Until now, users have had little transparency into the flow of model-driven apps unless they are comfortable wading through the complexity of browser developers tools or Fiddler. It was hard to find events and logs that could help diagnose performance and functional issues.
We’re excited to announce that the Monitor tool is now available for model-driven apps! The Monitor tool (currently supported on canvas apps) provides a way to view a stream of events from a user’s session in order to diagnose an issue. As of this blog post, we support the following events on the latest build:
- KPI for page loads, command executions, and other major events
- Network request details
- Warnings for synchronous XHR’s
- Custom script errors (e.g. onload, ribbon rule evaluation)
- Form execution event details (e.g. onload, onchange)
- Form visibility reasons for controls and related menu items
- Power BI control failure and performance events
Note: depending on your CDS/Dynamics version, you may see a subset of these events as they roll out to your org. Monitor for model-driven apps is currently only supported for browser sessions on online organizations.
Let’s take a look at Monitor in action!
There are two ways to enter a Monitor session for model apps.
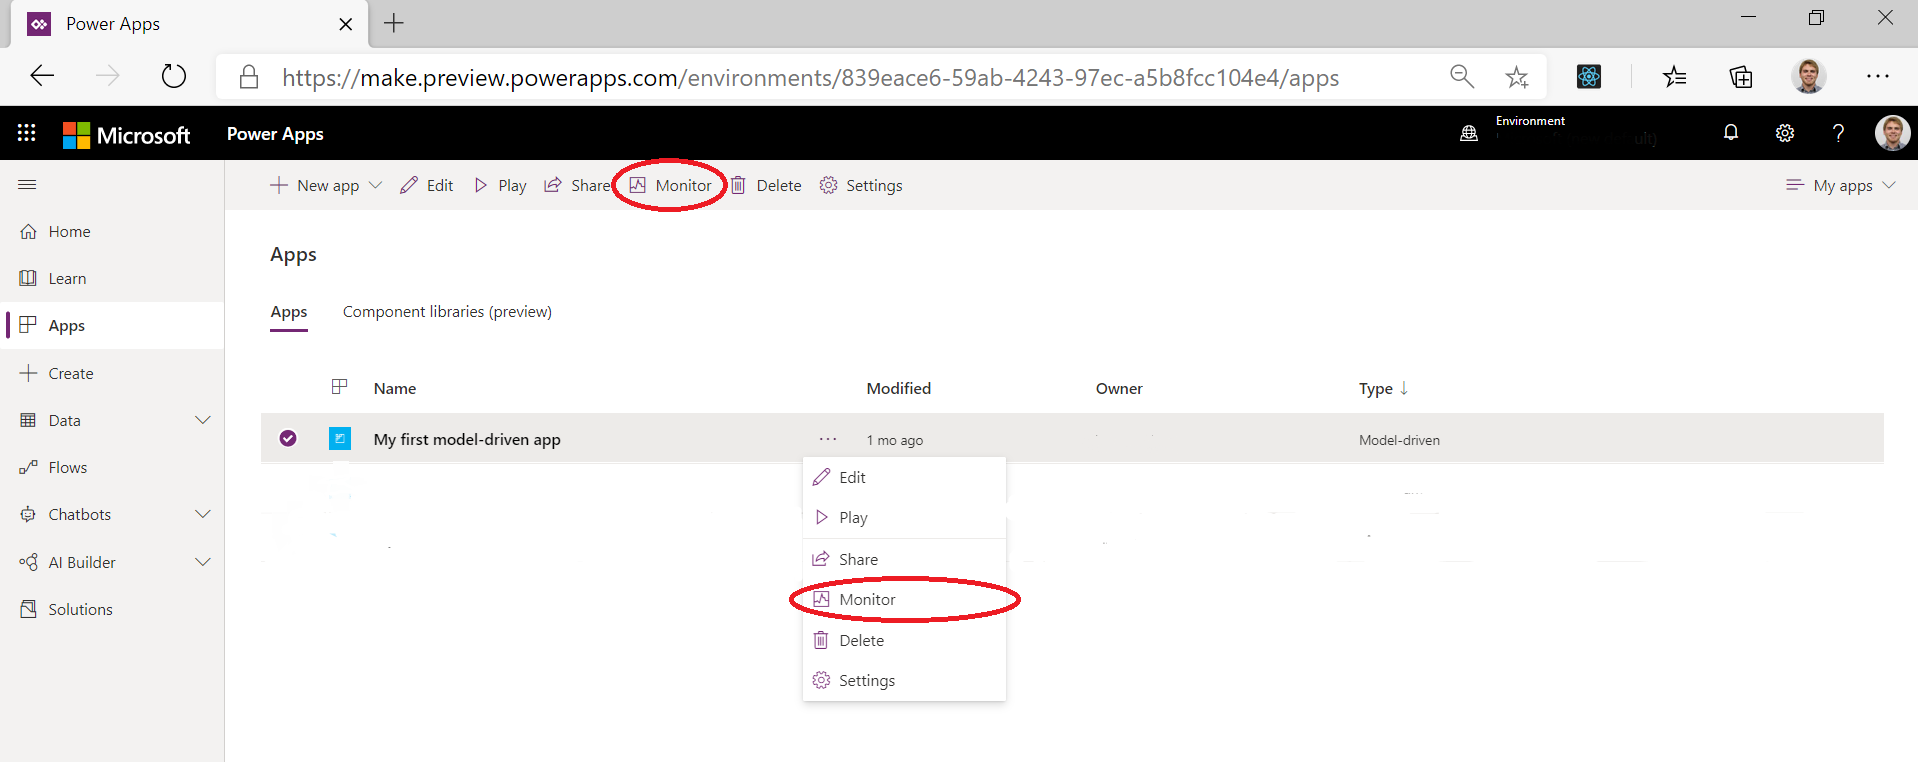
- Use the Monitor command from the apps page in Power Apps (see recent blog post for details). Select any model-driven app and use the command from the top bar or the context menu to launch Monitor. Then hit “Play model-driven app” from the Monitor page to launch your app.
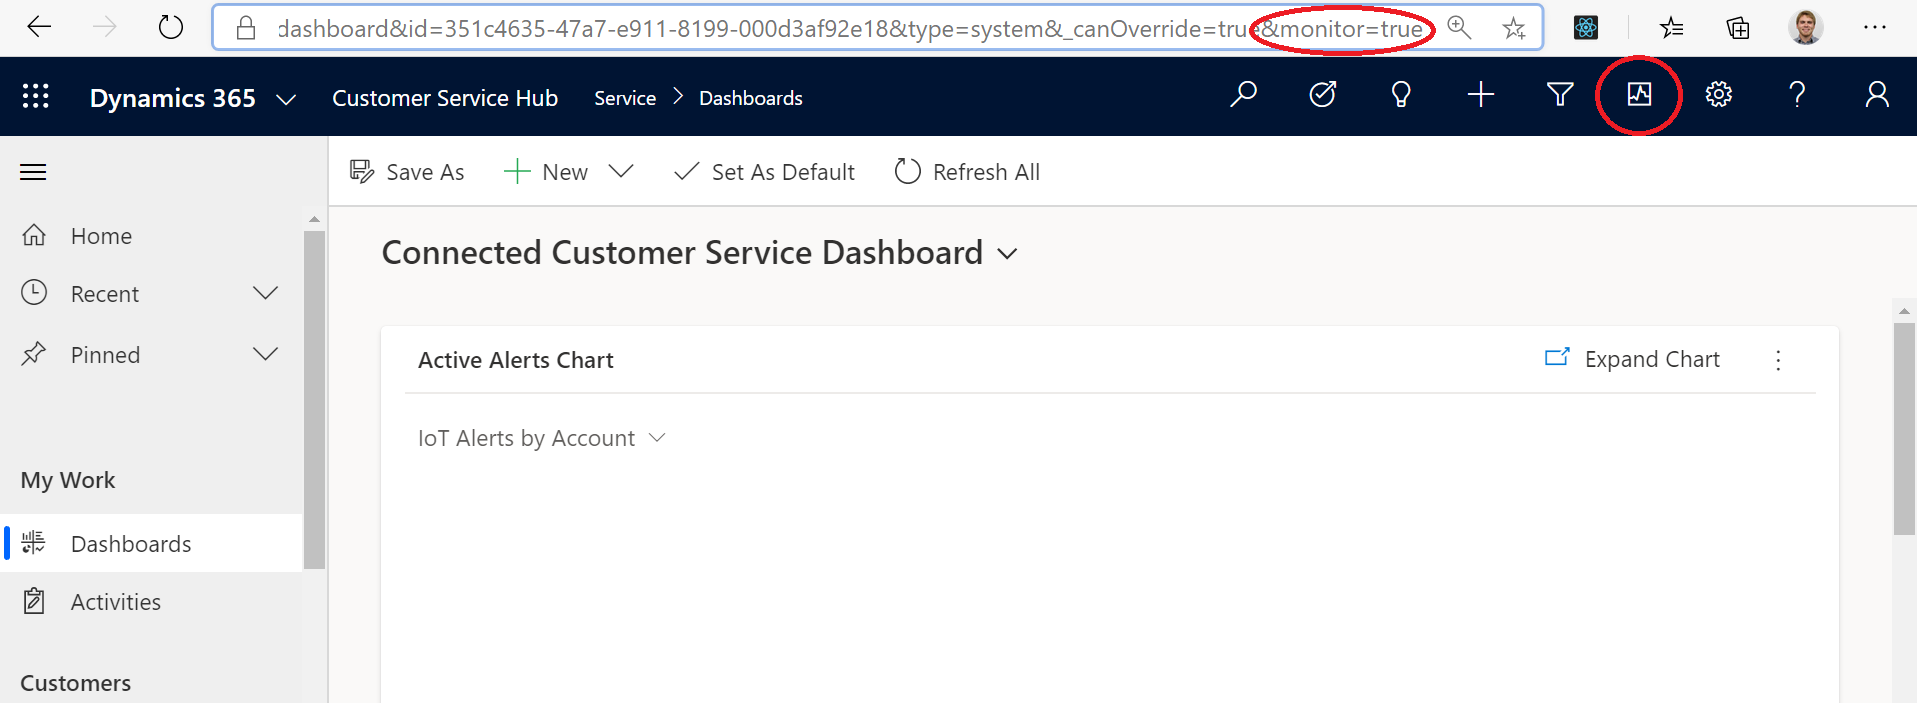
- Add “&monitor=true” to the end of the URL in the browser to show the Monitor button in the global command bar. Clicking this button will launch a Monitor session in a new tab. Note: as of this post, you need to “Play model-driven app” from the Monitor to connect a new session. In the future, we’ll automatically connect Monitor to the existing session.
Once the app is launched from Monitor, you’ll see a Join dialog letting you know that any data from the app will be sent to the Monitor owner.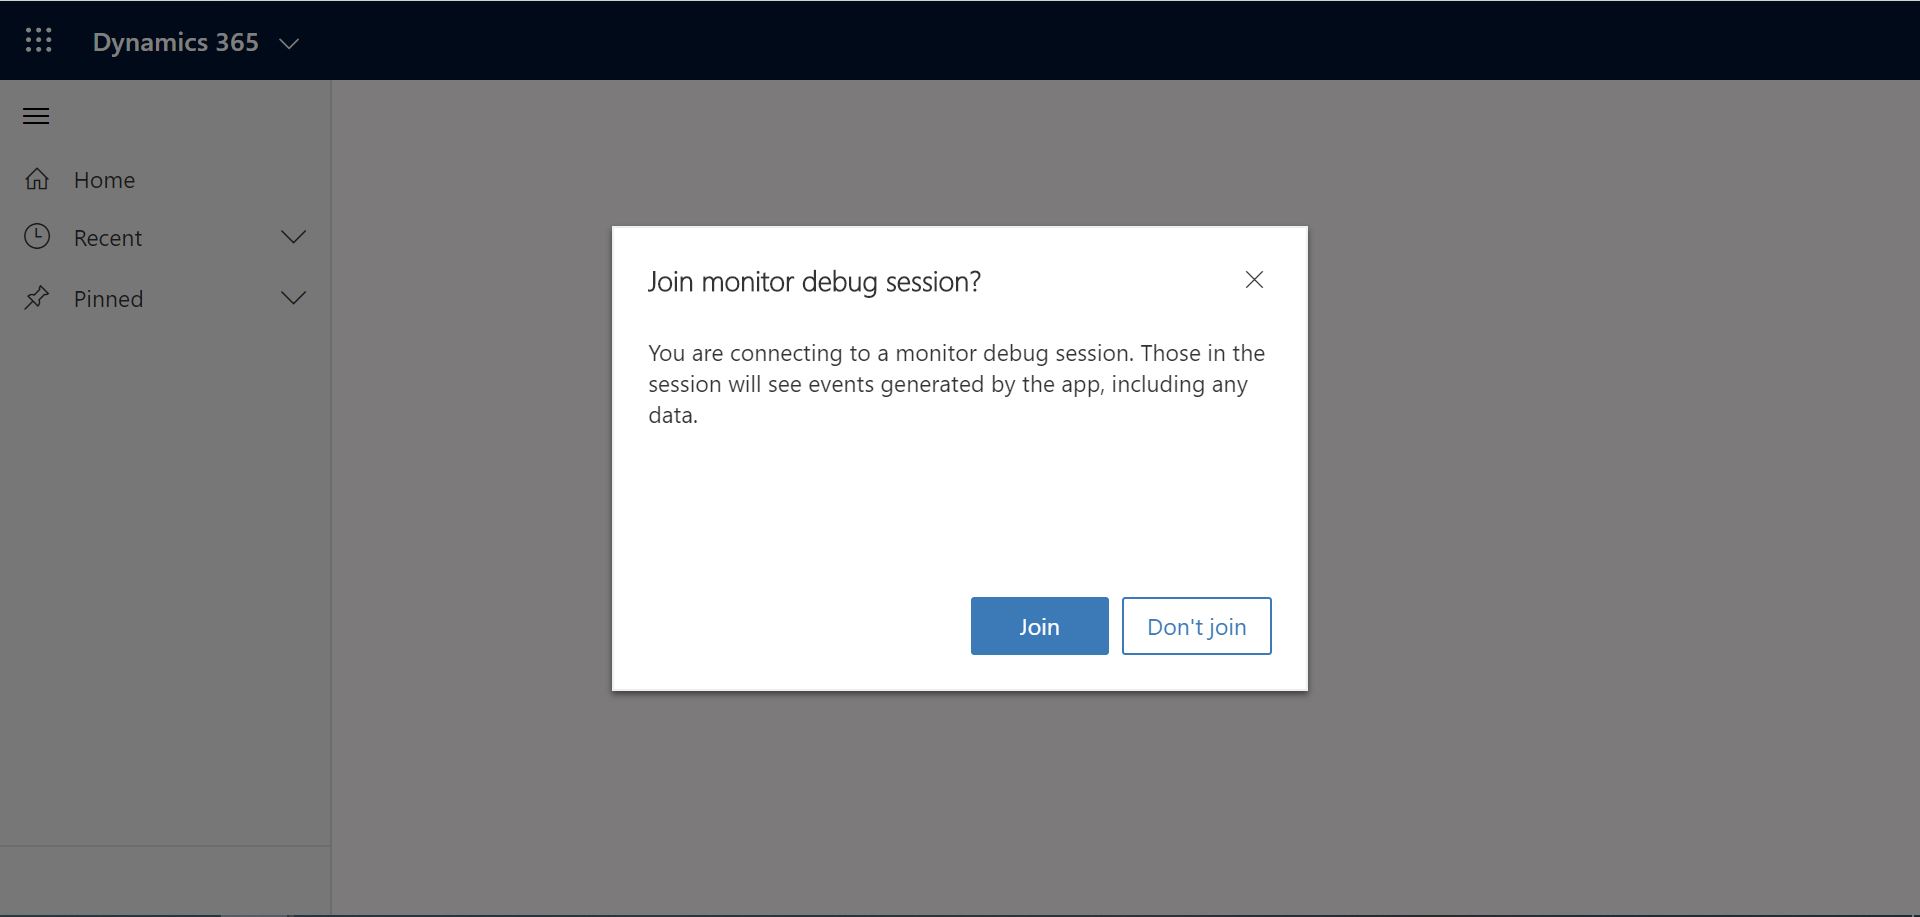
After hitting “Join”, events will start flowing to Monitor. Let’s take a look at what events are being sent.
Events
Page navigations, command executions, form saves, and other major actions will send KPI and network events to Monitor. Many events and fields are sent and supporting documentation will be published soon, but let’s take a look at some key ones below:
FullLoad signifies the complete load of a page navigation, such as an edit form load. This waits for certain network requests to complete and all rendering to finish, so the form may indeed be usable before FullLoad completes.


The FullLoad event captures many statistics about the page load. You can see the task edit form loaded in 506 ms, and clicking on the row reveals a wealth of information in the property pane. As mentioned above, we will add more documentation on each field, but you can immediately see details on customScriptTime (time spend execute custom JavaScript), loadType (0 = first time loading page type, 1 = first time loading entity, 2 = first time loading record, 3 = exact record has been visited), and FormId (form identifier for further diagnosis). Expanding Attribution gives a breakdown of custom JS execution time by type, publisher, solution, version, web resource, and method. This can quickly help identify bottlenecks in form load time.
The Network events reveal details about each request made from the app:
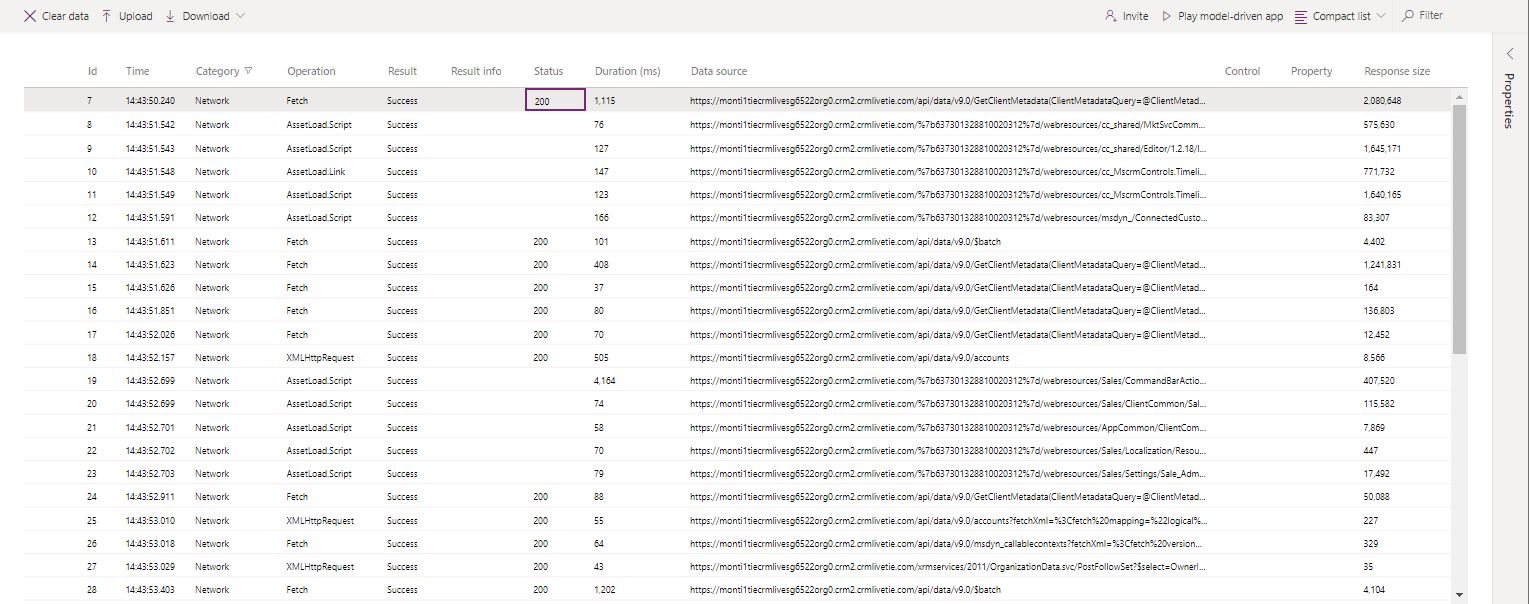
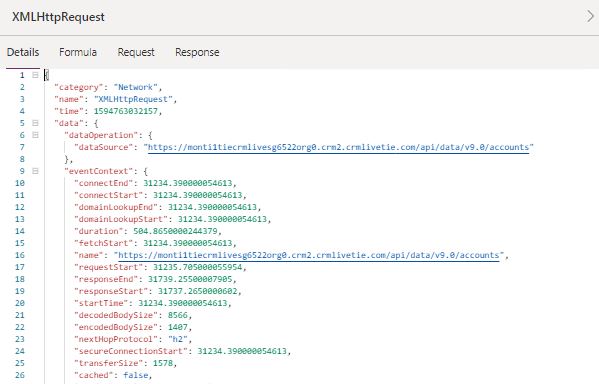
You can see well-known network statistics like requestStart, responseStart, and decodedBodySize (see MDN documentation), as well as custom properties like whether the request was cached and sent as a fetch or XMLHttpRequest.
Solving issues and slow performance
Let’s look at a few scenarios where Monitor can shed light and solve script errors, unexpected behavior, and slowdowns.
Custom script errors
Sometimes, a bug in the custom JS will cause a script error or functionality issue when loading a page. While this usually produces a call stack in the dialog, it’s hard to always know where it’s coming from or decode the error. Monitor will receive an event from the app with more details on the error so you can debug more quickly and easily.
Let’s say a user is experiencing a script error dialog on account form load. We can use Monitor to get more details on the event. Once the scenario is reproduced, you can see the script error produces an error event highlighted in red. Clicking on this row gives us not only the call stack but the publisher name, solution name/version, web resource name, and type (onload, onchange, RuleEvaluation, CustomControl, etc.). Looks like a typo in the script, and we have a publisher to contact for a fix!

Slow performance
Browser developer tools can help profile slow page loads, but there is a lot of data to filter though and it’s not clear what is important to look at. Monitor aims to solve that by showing relevant events that contribute to page load performance.
Let’s say a user is experiencing slow account form loads, and the browser is constantly freezing up. In this case, once we reproduce, we can immediately see a performance warning telling us that a synchronous XMLHttpRequest was sent during the load which degraded performance.

See previous blog post for how to alleviate synchronous XHR performance issues.
For every page load, we send all KPI for the loading sequence as well as network request details as mentioned earlier.
Form control and related menu display
Look for a deeper blog post on this soon, but to give a sneak preview, Monitor will show events regarding tab and control visible/enabled state on the edit form.
If a user is wondering why a field isn’t showing up on an edit form, Monitor can easily help demystify. In this scenario, the Last Campaign Date is not showing up on the account form. There are series of uci_formchecker_* events produced on an edit form load (use the Category column filter if needed). Once reproduced in a Monitor session, we can see the following event with Category uci_formchecker_controlstate_events.

Drilling into the details, we can scroll to Last Campaign Date and clearly see that The control is disabled in the form XML. The action item is to Contact the form or entity owner to change it.
Feedback
We’re adding more events to model-driven apps every week to help diagnose common issues. As always, please feel free to provide any feedback in the comments below or in our community post. We’d like to know what’s useful to best support troubleshooting and transparency.
